

Traffic Events Logging
Updated
This feature is available in NetBird Cloud under the Business plan and in licensed self-hosted Enterprise deployments with traffic flow enabled. This feature is in Beta and may change over time — including how data is collected and reported. To use this feature, make sure you're running NetBird client version 0.39 or higher.
The traffic events logging functionality enables comprehensive monitoring and analysis of connections across your infrastructure. It captures network activity, including peer-to-peer, site-to-site, peer-to-resource, and other network traffic events.
It provides detailed visibility into connections and network traffic flow, helping to answer key questions such as who initiated the connection, what resource was accessed, when it happened, where it originated, and why it was allowed. By enhancing network monitoring capabilities, it strengthens security measures and delivers actionable operational insights, empowering you to better manage and secure your environment.
How Traffic Events Logging Works
NetBird offers flexibility as a peer-to-peer (p2p) overlay network and a remote network access solution. You can use NetBird to connect machines directly (p2p) when running the NetBird client on each machine. You can also use NetBird to organize remote employee access to internal networks like VPCs, office networks, and internal services without running the NetBird client on the remote resources using the NetBird Networks feature. The way you use NetBird influences the way traffic events are captured and logged. Below are the two main scenarios for traffic events logging that describe how NetBird logs traffic events for different types of connections.
Peer-to-Peer Connections
When two peers are connected directly (p2p), NetBird captures and logs the traffic events for that connection on both peers. For example, if a user accessed an internal CRM server from their laptop via a browser and port 443, NetBird would log the traffic events for that connection on both the user's machine and the CRM server. If the connection was blocked, such as when there is a policy that restricts access to the CRM server, NetBird would log the blocked event on the peer that refused the connection.
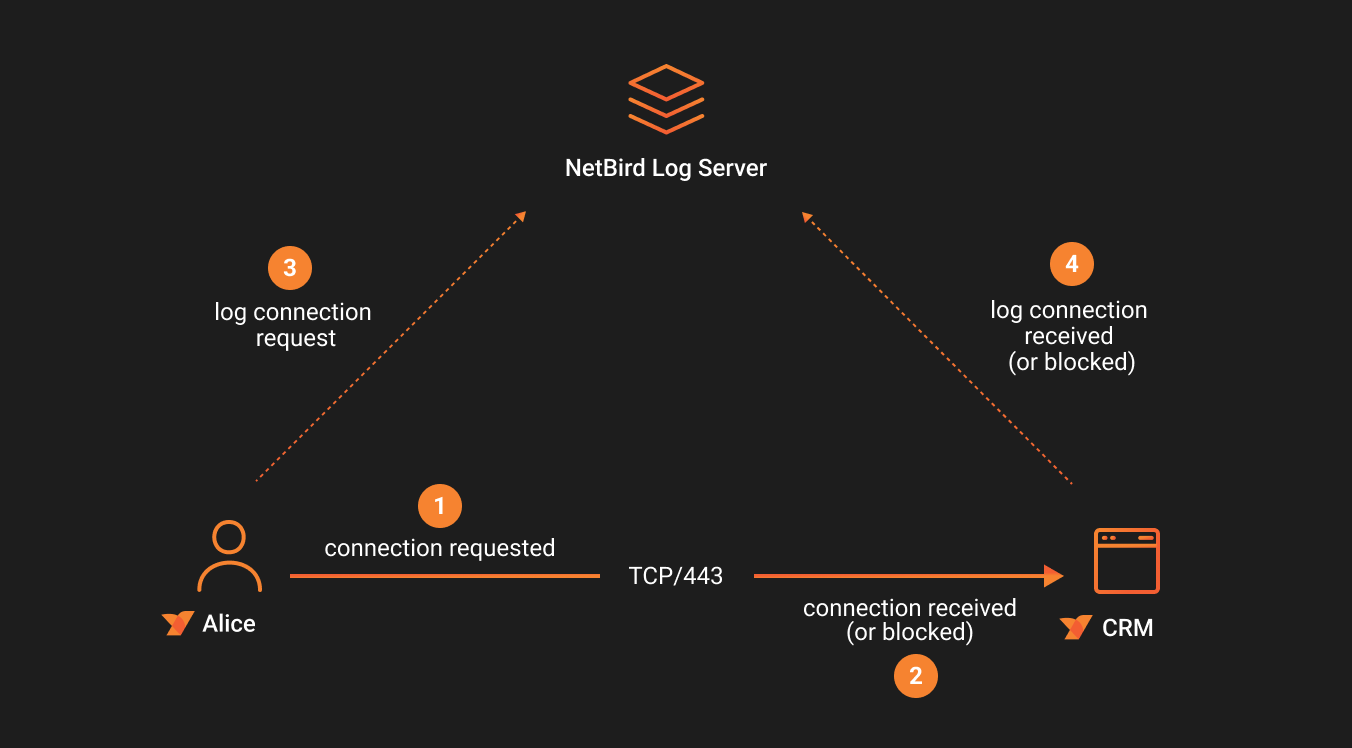
Successful P2P Connection Events
NetBird helps you better understand connection flows by aggregating related events and presenting them in a clear, organized manner.
For example, in a successful peer-to-peer connection scenario, a user initiates a connection from the peer Alice to the peer server.
This is illustrated in the screenshot below.
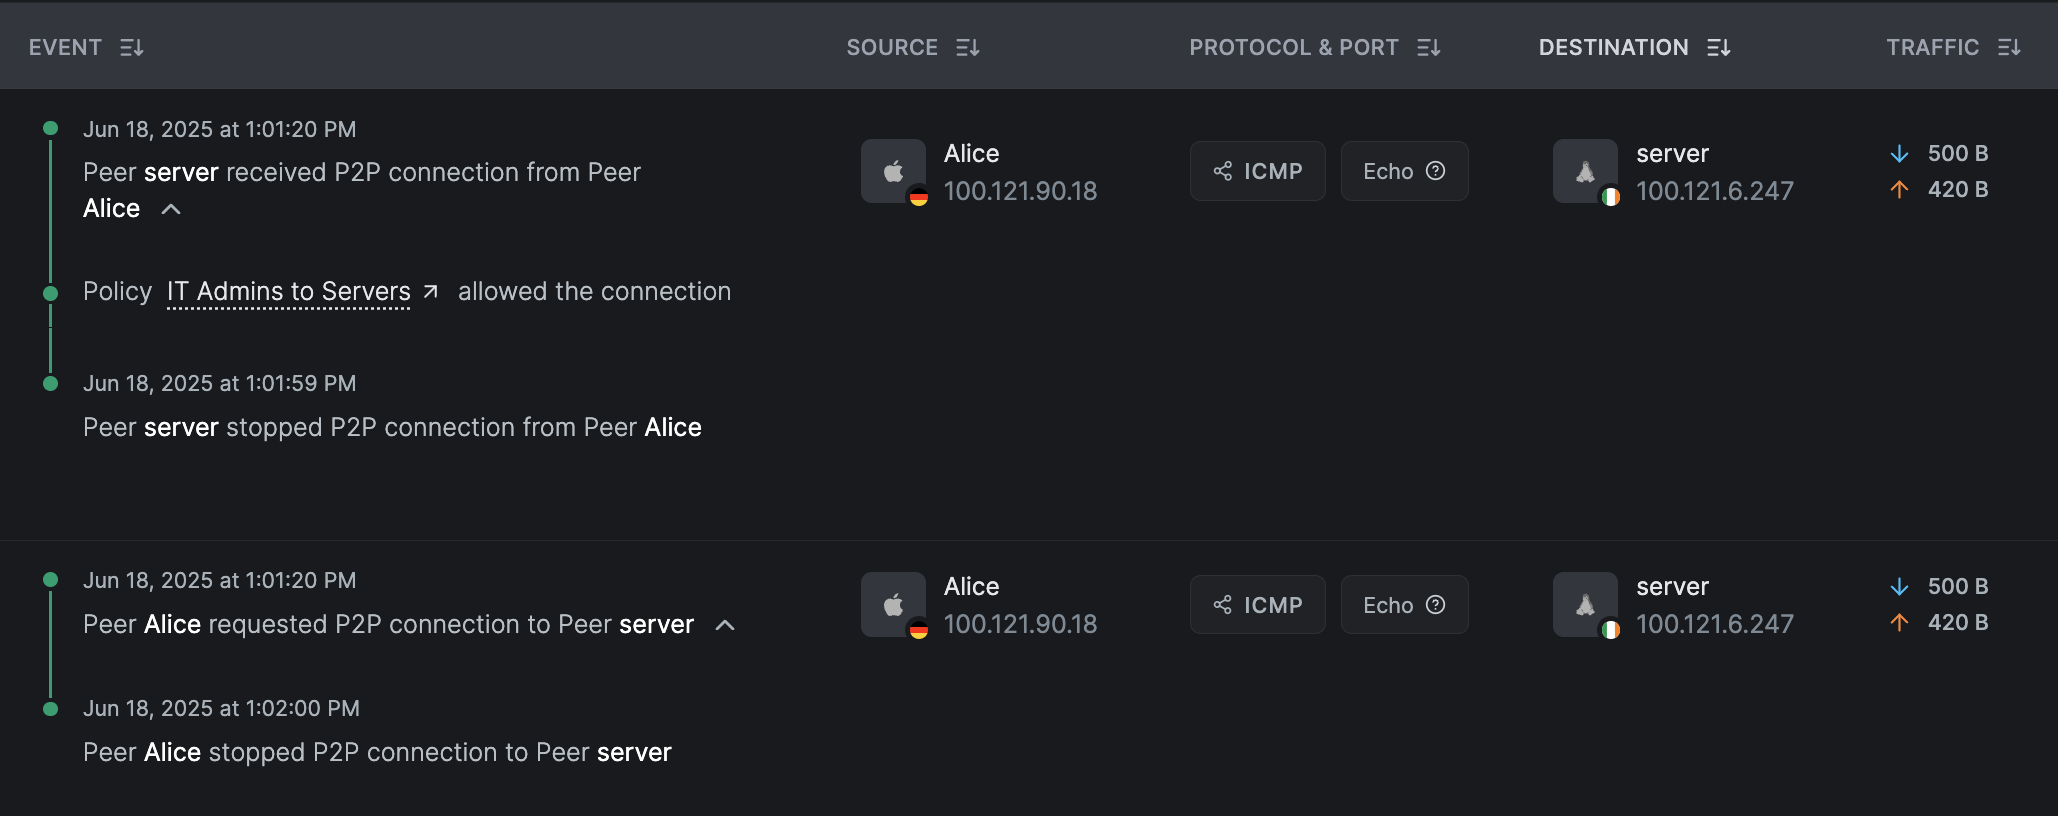
You'll see two aggregated flow records, one reported by each peer (source and destination). The record from Alice counts the connection start and end from the initiator's perspective.
The record from server represents the receiver's perspective. Because server allows the connection, it includes the policy IT Admins to Servers that authorized the flow over TCP on port 443.
Use the P2P filter in the table to view only peer-to-peer connection events.
Blocked P2P Connections Events
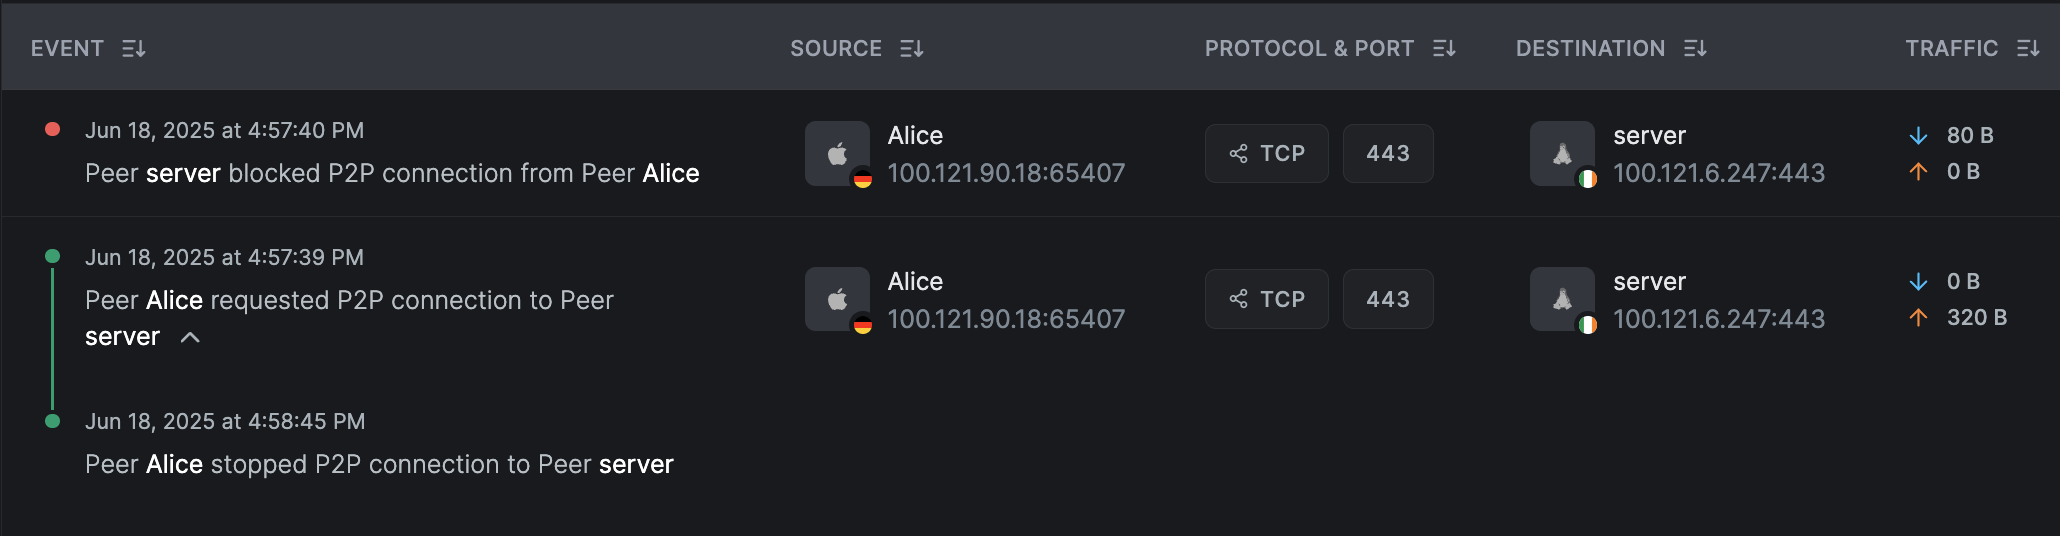
If a connection is refused, NetBird logs the blocked event on the peer that denies the connection, in this case, server.
The initiating peer Alice will still report the connection attempt but won't be aware that it was blocked.
In this scenario, the IT Admins to Servers policy is configured to allow only ping requests (ICMP),
meaning all HTTP requests are intentionally not allowed. The screenshot below illustrates this behavior.
Peer-to-Network Resource Connections
When a peer connects to a network resource, NetBird captures and logs the traffic events for that connection on the peer that initiated the connection, and on the routing peer that connects the peer to the internal network resource.
A slightly modified example of the CRM server connection scenario would be if instead of running the NetBird client on the CRM server, you used the NetBird Networks feature and created a network resource for the CRM server. In this case, if a user accessed an internal CRM from their laptop via a browser and port 443, NetBird would log the traffic events for that connection on the user's machine and the routing peer that routed the connection to the CRM server. If the connection was blocked, NetBird would log the blocked event on the routing peer.
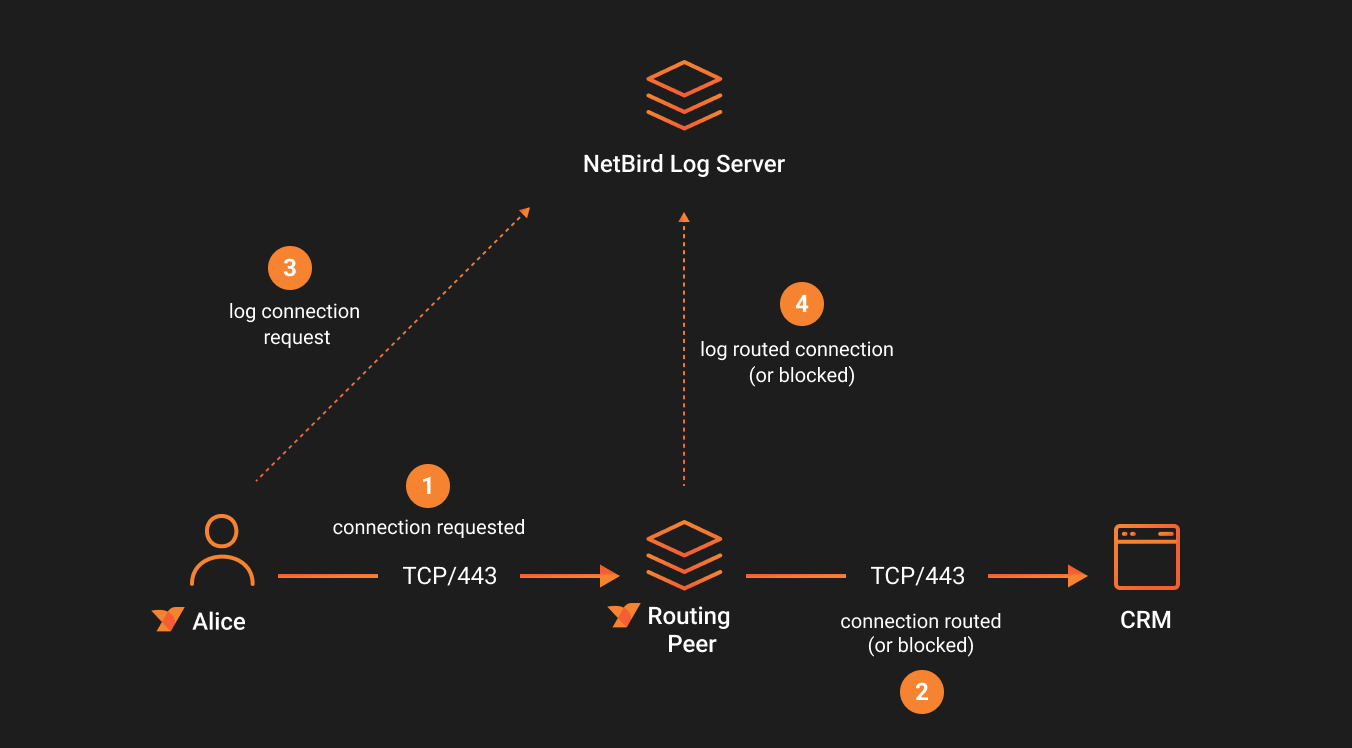
Successful Peer-to-Network Resource Events
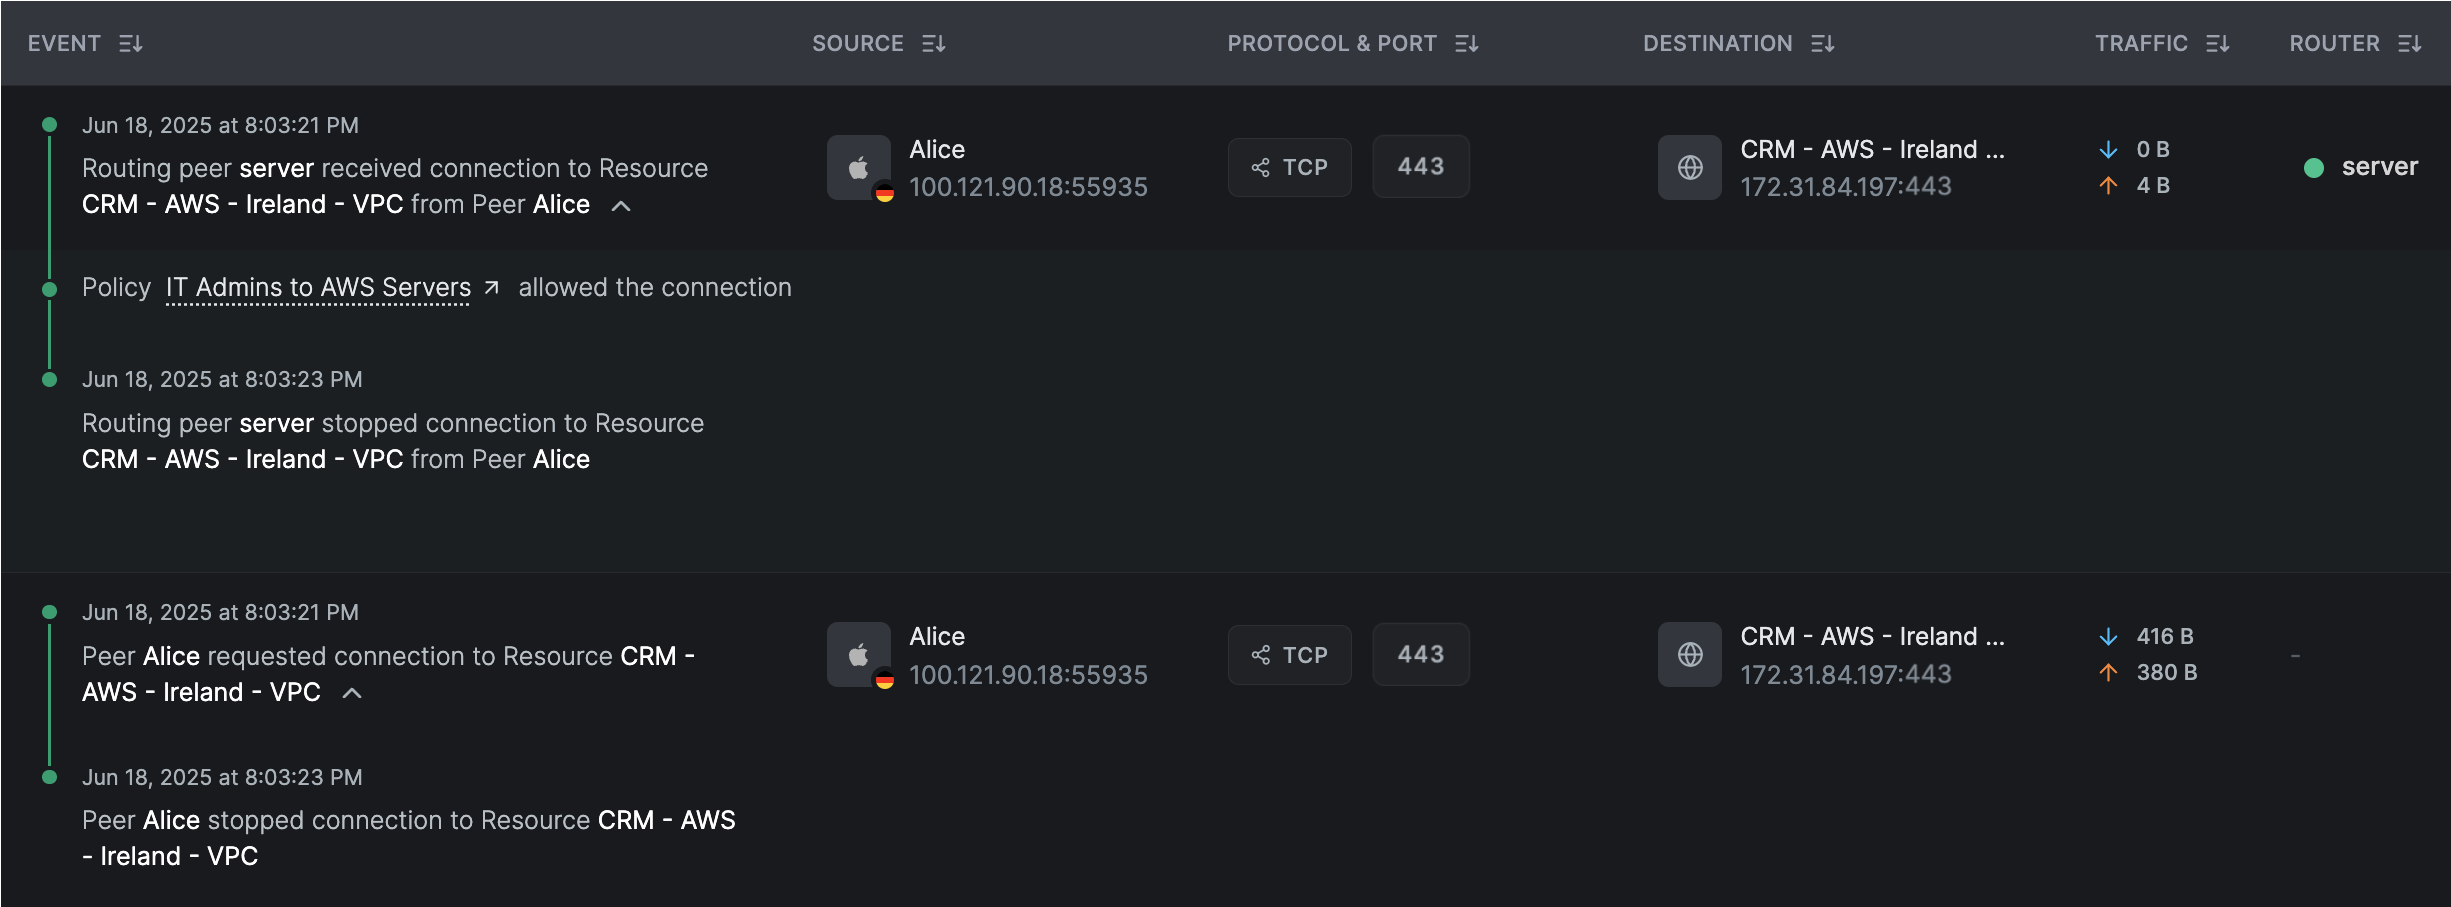
The screenshot below illustrates a successful connection from Alice to the network resource CRM running in the AWS VPC.
The traffic is routed through a routing peer, which logs the connection event and reports it to the NetBird servers.
The access is permitted by the policy IT Admins to AWS Servers, which allows connections over the TCP protocol on port 443.
Note the ROUTER column in the table, which identifies the routing peer responsible for routing to the internal network resource.
Use the Routed filter in the table to view only peer-to-network resource connection events.
Blocked Peer-to-Network Resource Events
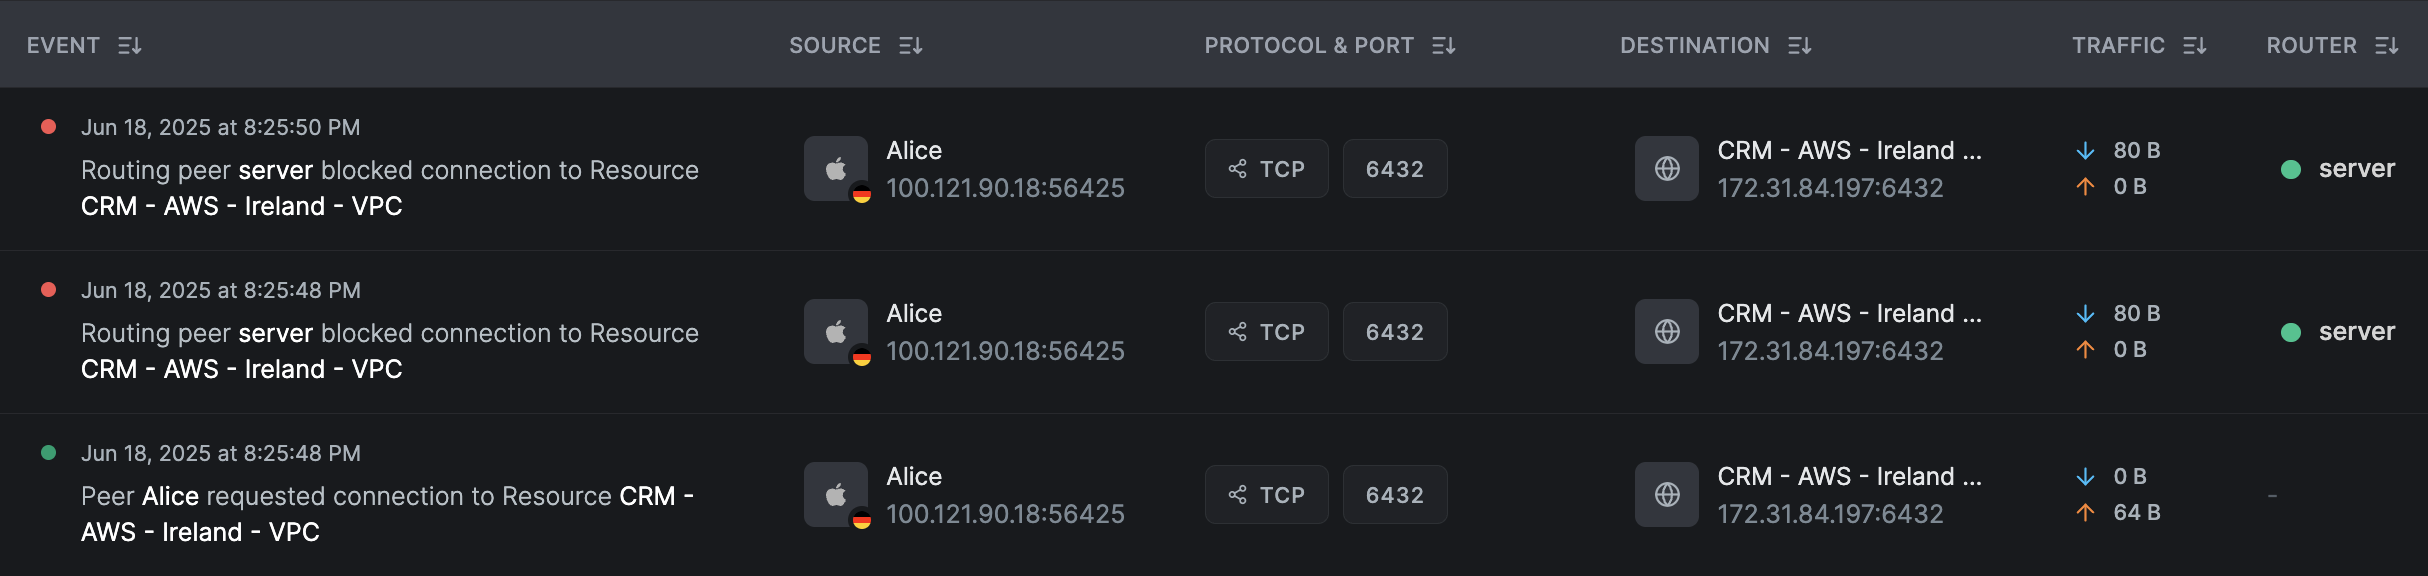
In the event of a blocked connection, the initiating peer logs the connection attempt, while the routing peer records the blocked event.
The screenshot below demonstrates this behavior: the routing peer blocks a connection to the network resource CRM because
the policy IT Admins to AWS Servers does not permit connections over the HTTP protocol on port 6432.
The routing peer's aggregate shows the number of dropped attempts, so repeated application retries increase the drop count instead of creating one top-level row for every attempt.
For all the examples above, we used the nc command to initiate the connection to the CRM server from the peer Alice.
E.g., nc -v crm.netbird.cloud 443.
Event Aggregation
Starting with v0.75, clients aggregate related traffic events before reporting them. For a given source address and direction, a group is identified by protocol, destination address, destination port for TCP or UDP, and ICMP type for ICMP traffic. Source port and ICMP code do not split aggregates. During each reporting window, NetBird accumulates:
- connection start, end, and drop counts;
- transmitted and received packet totals;
- transmitted and received byte totals;
- the start and end of the aggregation window.
The Dashboard and API therefore present one flow record with counters for activity in that window instead of a separate top-level record for every start, end, or blocked event. The events array can retain individual event timestamps where they are available.
Enabling Traffic Events Logging
Traffic events logging feature is disabled by default. To enable it on the NetBird dashboard, navigate to Settings > Networks.
Under the Experimental section, you'll find the Enable Traffic Events option. Toggle the switch to enable traffic event logging.
By default, traffic reporting in userspace is always enabled, providing basic logging of network interactions. However, packet size reporting at the kernel level is disabled by default to minimize CPU usage.
You can optionally enable Traffic Reporting (Kernel) to capture additional details, such as network packet sizes,
at the kernel level. Be aware that enabling this option may lead to higher CPU usage on the NetBird client.

Limiting Traffic Events to Specific Groups
You can scope traffic events logging to only the peers that belong to specific groups.
- When you select one or more groups, only peers that are members of the selected groups will report traffic events.
- If no group is selected, logging applies to all peers in the account (default behavior).
To configure this setting, navigate to Settings > Networks in the Experimental section, open the Group Selector under Enable Traffic Events
choose the groups you want to include, and click Save Groups.
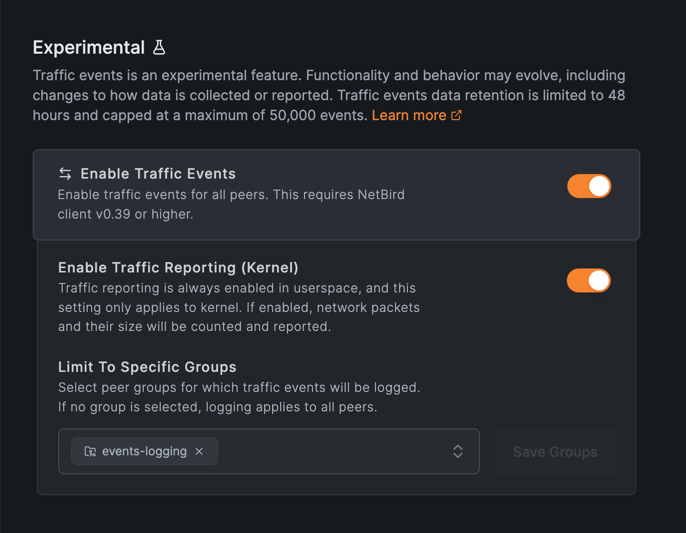
Changes to these settings, including the group scope, are pushed to connected peers and take effect without restarting the NetBird client. Every change is also recorded in the audit events log.
Log Retention
While in experimental mode, logs are retained for seven days. Additionally, the current API returns a maximum of 50,000 flow records. This limit may change.
In self-hosted Enterprise deployments, the retention period is set by NB_PERSISTENCE_RETENTION_PERIOD on the enricher service. The installer sets it to 168h (seven days).
Report rate
Aggregated flows might take up to ten minutes to become available through the API and Dashboard. An end count for some TCP connections can appear in a later window, depending on OS settings and connection termination.
Enable Traffic Events Streaming to SIEM Systems
NetBird allows you to stream traffic events directly to your Security Information and Event Management (SIEM) system in real time. By enabling this feature, you can seamlessly monitor and analyze NetBird network flow events within your existing SIEM infrastructure, enhancing your ability to detect and respond to security events.
For detailed instructions on supported integrations and how to set them up, refer to the integrations guide.
Streamed event fields
A streamed traffic event uses the same envelope as a streamed audit event: an event ID, a timestamp, and a message. Clients from v0.75 send aggregated events, whose message is always TYPE_UNKNOWN, so read activity from the num_of_* counts instead. The initiator and target fields are empty, and the reference field is empty or, for Datadog, omitted. Envelope field names depend on the integration: Datadog uses id and timestamp, Generic HTTP uses ID and Timestamp. The flow details are in meta, under the same keys for every integration unless you set a custom Generic HTTP body template:
- User:
user_id, the ID of the user associated with the source peer. - Flow:
flow_id,reporter_id(the peer that reported the event),protocol,direction,policy_id,policy_name,icmp_type, andicmp_code. - Source and destination:
source_id,source_name,source_addr,source_dns_label,source_connection_ip,source_geo_city, andsource_geo_country, with the same set ofdestination_*fields. - Volume:
rx_bytes,rx_packets,tx_bytes, andtx_packets. - Counts:
num_of_starts,num_of_ends, andnum_of_drops. - Timing:
received_timestamp, the time the event reached the NetBird servers.
Compared with API responses, streamed events do not include the user's name or email, the aggregation window start and end, or the operating system of the source and destination. user_id is empty when the source peer has no associated user, such as a peer registered with a setup key, and when the source is not a peer.
Streaming delivery
Each traffic event is saved to the traffic events store before it is streamed, so an event that fails to stream is still visible in the Dashboard and API. The NetBird client resends each event until the NetBird servers acknowledge it. Once an event reaches the servers, every step up to saving it is retried: the servers acknowledge an event only after queueing it, and remove it from the queue only after saving it. If server processing falls behind, events wait in the queue and arrive late rather than being dropped.
In rare cases, such as a server restart while an event is being processed, the same event can be streamed twice. Deduplicate on the event ID.
Changes to a stream destination take up to five minutes to apply, and what happens when the destination is unreachable depends on the integration; see Delivery.
Traffic Events Data
When enabled, a NetBird peer will record metadata for each network flow that it participates in. The data collected by peers includes:
- Window start and end: The bounds of the aggregation window.
- Flow ID: A unique identifier for the aggregated traffic flow.
- Event counts:
num_of_starts,num_of_ends, andnum_of_dropsfor the group. - Source and Destination IP Addresses: The IP of the peer (source) and the IP of the remote endpoint (destination). For peer-to-peer traffic, these will be the NetBird network IPs (e.g. 100.x.x.x addresses of each peer). For traffic to an external resource (like a private server or subnet), the destination might be an IP in that remote network.
- Source and Destination Ports: The network ports recorded for TCP/UDP flows. Destination port is part of the aggregation key; source port does not split aggregates.
- ICMP Type: For ICMP traffic, the ICMP type used to group the flow. ICMP code does not split aggregates.
- Protocol: The protocol of the traffic, such as TCP, UDP, or ICMP.
- Direction: Whether the flow was inbound or outbound. This takes into consideration the perspective of the peer reporting the traffic and the NetBird interface.
- Volume of Data: Packet and byte totals sent and received during the aggregation window.
- Resource ID: Network route or Networks resource ID that the flow is associated with. This is useful for identifying the routing configuration that allowed the flow. DNS route information is available only on the routing client.
- Rule ID: The ID of the policy that allowed the flow. This is useful for identifying the access control policy that allowed the flow. This information is available only on the receiving side of the traffic.
In addition to the data collected by the peers, the NetBird API provides additional context about the peers and resources involved in the traffic event. These details include:
- Peer Name: The name of the peer.
- Peer ID: The unique identifier of the peer.
- Resource name: The name of the resource or network route.
- Policy Name: The name of the policy that allowed the flow.
- User ID, name, and email: The name and email of the user associated with the source peer. The API looks these up when you query it; streamed events carry the user ID only.
- Reporter ID: The unique identifier of the peer that reported the traffic event.
- Received timestamp: The timestamp when the event was received by the NetBird servers.
API sample response
  {
    "destination": {
      "address": "142.250.185.206:443",
      "dns_label": "*.google.com",
      "geo_location": {
        "city_name": "",
        "country_code": ""
      },
      "id": "cvco2st9q2cs73btphmg",
      "name": "Any google.com domain",
      "os": "",
      "type": "DOMAIN_RESOURCE"
    },
    "direction": "EGRESS",
    "flow_id": "9682d060-3b28-4fa3-8b47-98595a51bbda",
    "icmp_code": 0,
    "icmp_type": 0,
    "id": "c94e398c-dbfb-4344-8c47-a731b984d86e",
    "policy_id": "ndkslcanlksncl",
    "policy_name": "Allow google access",
    "protocol": 6,
    "receive_timestamp": "2025-03-22T20:26:19.491144Z",
    "reporter_id": "ldkfnwklenfklernl",
    "rx_bytes": 0,
    "rx_packets": 0,
    "source": {
      "address": "100.89.67.186:50229",
      "dns_label": "macbook-pro-10-2",
      "geo_location": {
        "city_name": "Frankfurt",
        "country_code": "DE"
      },
      "id": "ldkfnwklenfklernl",
      "name": "MacBook-Pro-10.local",
      "os": "Darwin",
      "type": "PEER"
    },
    "window_start": "2025-03-22T20:26:16.937522Z",
    "window_end": "2025-03-22T20:30:17.257891Z",
    "num_of_starts": 1,
    "num_of_ends": 1,
    "num_of_drops": 0,
    "tx_bytes": 64,
    "tx_packets": 1,
    "events": [
      {
        "type": "TYPE_START",
        "timestamp": "2025-03-22T20:26:16.937522Z"
      },
      {
        "type": "TYPE_END",
        "timestamp": "2025-03-22T20:30:17.257891Z"
      }
    ],
    "user_email": "john@example.com",
    "user_id": "google-oauth2|xyz0123",
    "user_name": "John Doe"
  }
Viewing Traffic Events on the Dashboard
There are two places where you can see the traffic events on the NetBird dashboard:
- Traffic events: Under Activity, you will find the Traffic events menu. This view shows the traffic events in a table format for all peers in your network.
- Peer details: When you click on a peer, you will see the traffic events for that peer in the Peer details view.
Filters
You can use various filters to search and filter received events. The filters include:
- Source: Select a source peer, network resource, route, or user. The API equivalent is
source_id. - Destination: Select a destination peer or network resource. The API equivalent is
destination_id. - IP address: Source or destination IP addresses
- Ports: Source or destination ports
- Timestamp: Aggregation-window time range
- Protocol: ICMP, TCP, or UDP
- Flow type and direction: P2P or routed traffic, inbound or outbound, including groups with start, end, or drop counts
Correlating events
Correlate a session by comparing the aggregated flow records reported by both sides. If Peer A connects to Peer B, each reporter can contribute a record for the same source and destination tuple. A successful flow normally increases the start and end counters. If Peer B rejects it, the receiver's record increases the drop counter while the initiator may only know that it attempted the connection.
Blocked events are only reported when the destination peer is in userspace mode. See Limitations.
Viewing TCP and UDP connections
You can use endpoint addresses, destination ports, and the other flow fields to correlate TCP and UDP records. Below we will analyze a few examples for a connection between a user computer and Web and FTP servers.
The peer Maycons-MacBook-Pro.local initiates a connection to the Web server on destination port TCP/80. A successful aggregate has non-zero start and end counters and totals the packets and bytes transferred in the reporting window:
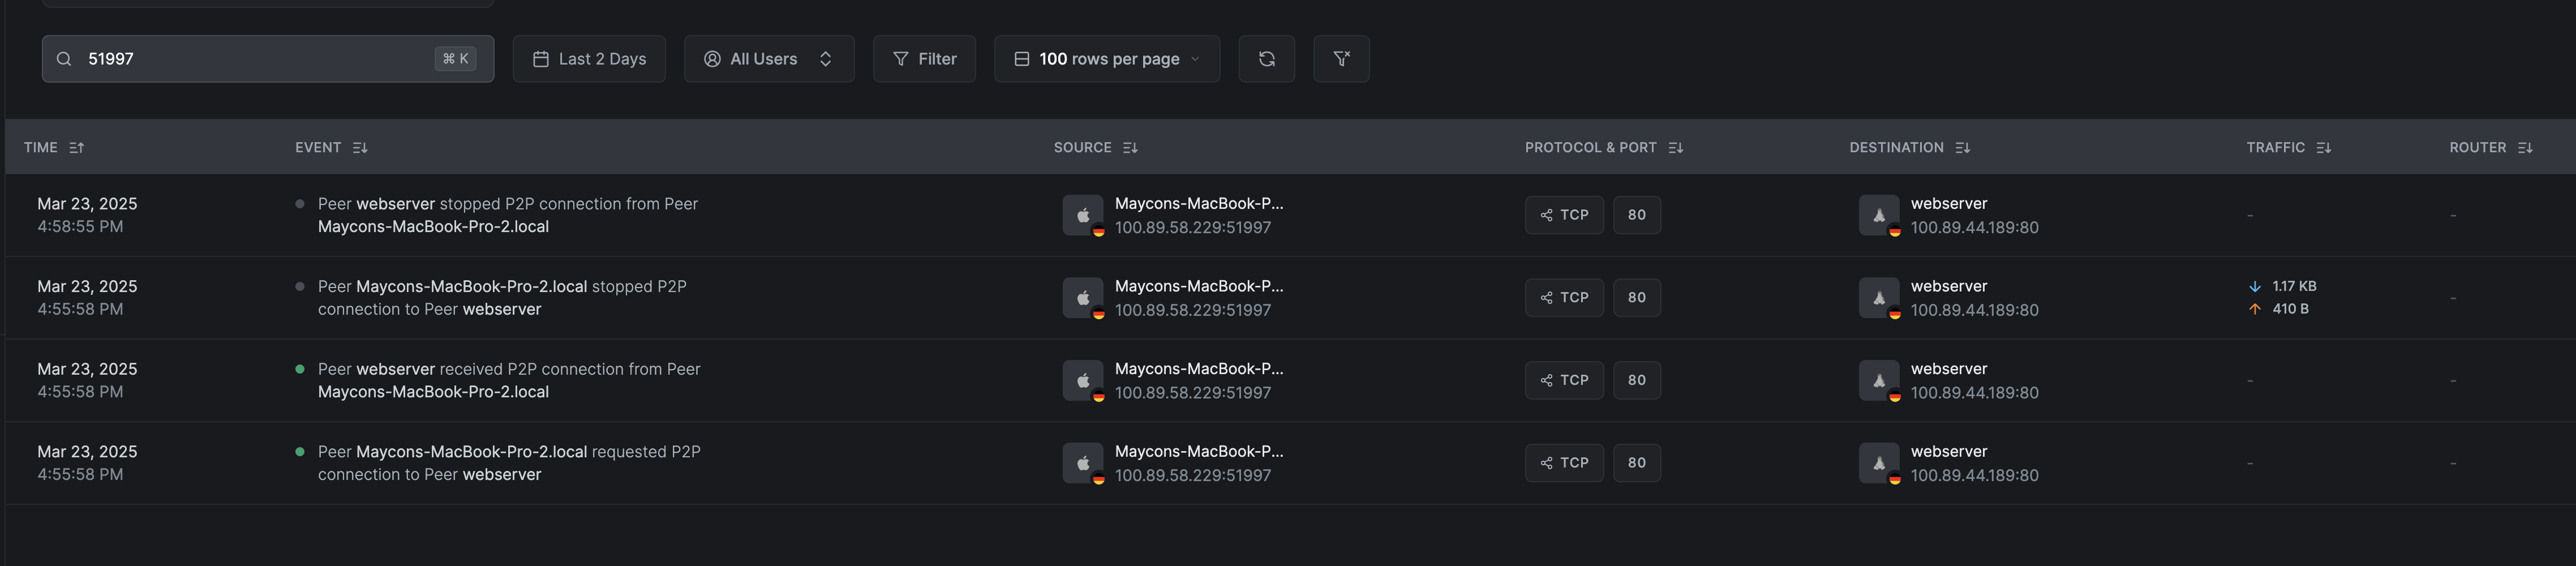
Use the reporter, source, destination, direction, protocol, and destination port to align the two perspectives. An end can be reported in a later window when the operating system keeps the TCP session open.
The UDP connection is very similar:

UDP is stateless, so its end counter is updated after the client observes the configured inactivity period.
When a connection is blocked, you may see similar entries to the following events but with a few differences:
TCP:

UDP:
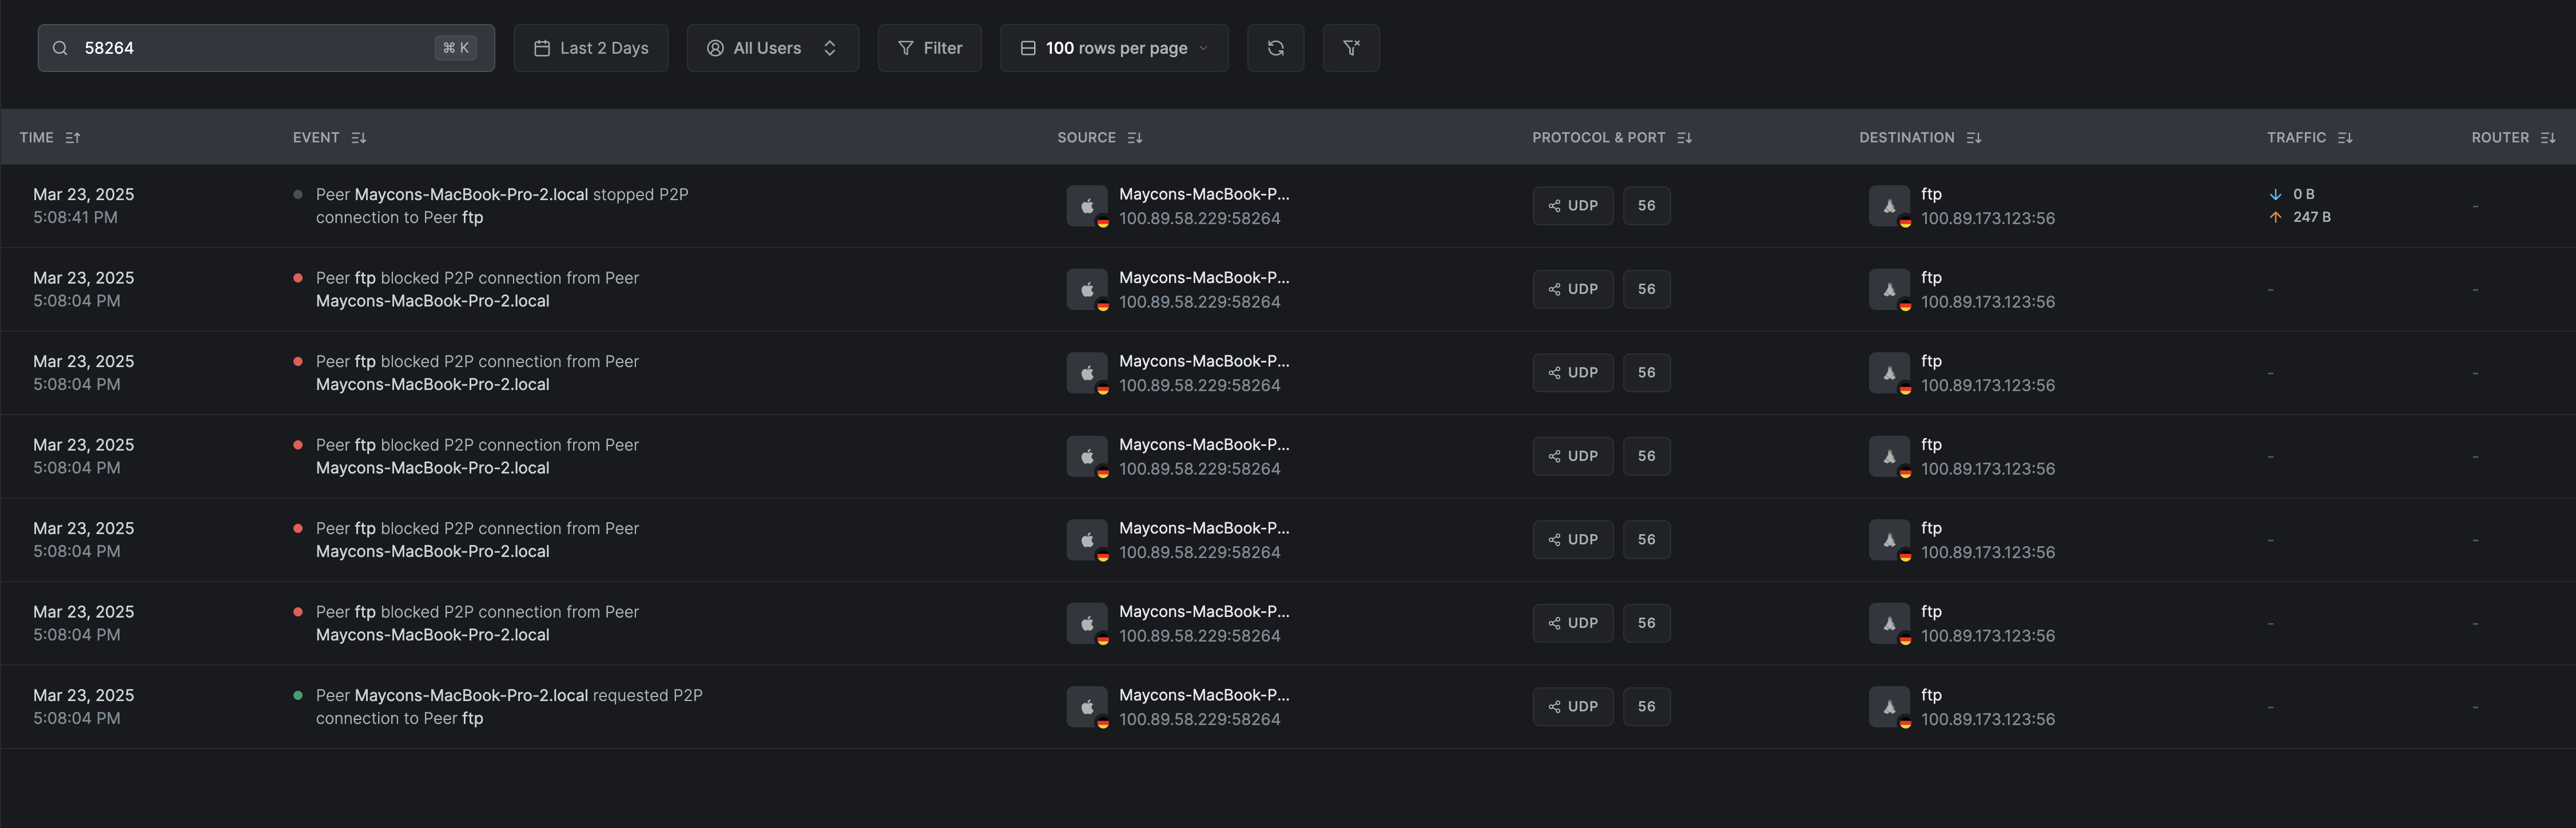
On the refusing side, retries increase num_of_drops; the client does not record a successful start or end for traffic it rejected.
Blocked events are only reported when the destination peer is in userspace mode. See Limitations.
Viewing ICMP connections
ICMP events are similar to TCP and UDP events. The main difference is that ICMP doesn't have ports:
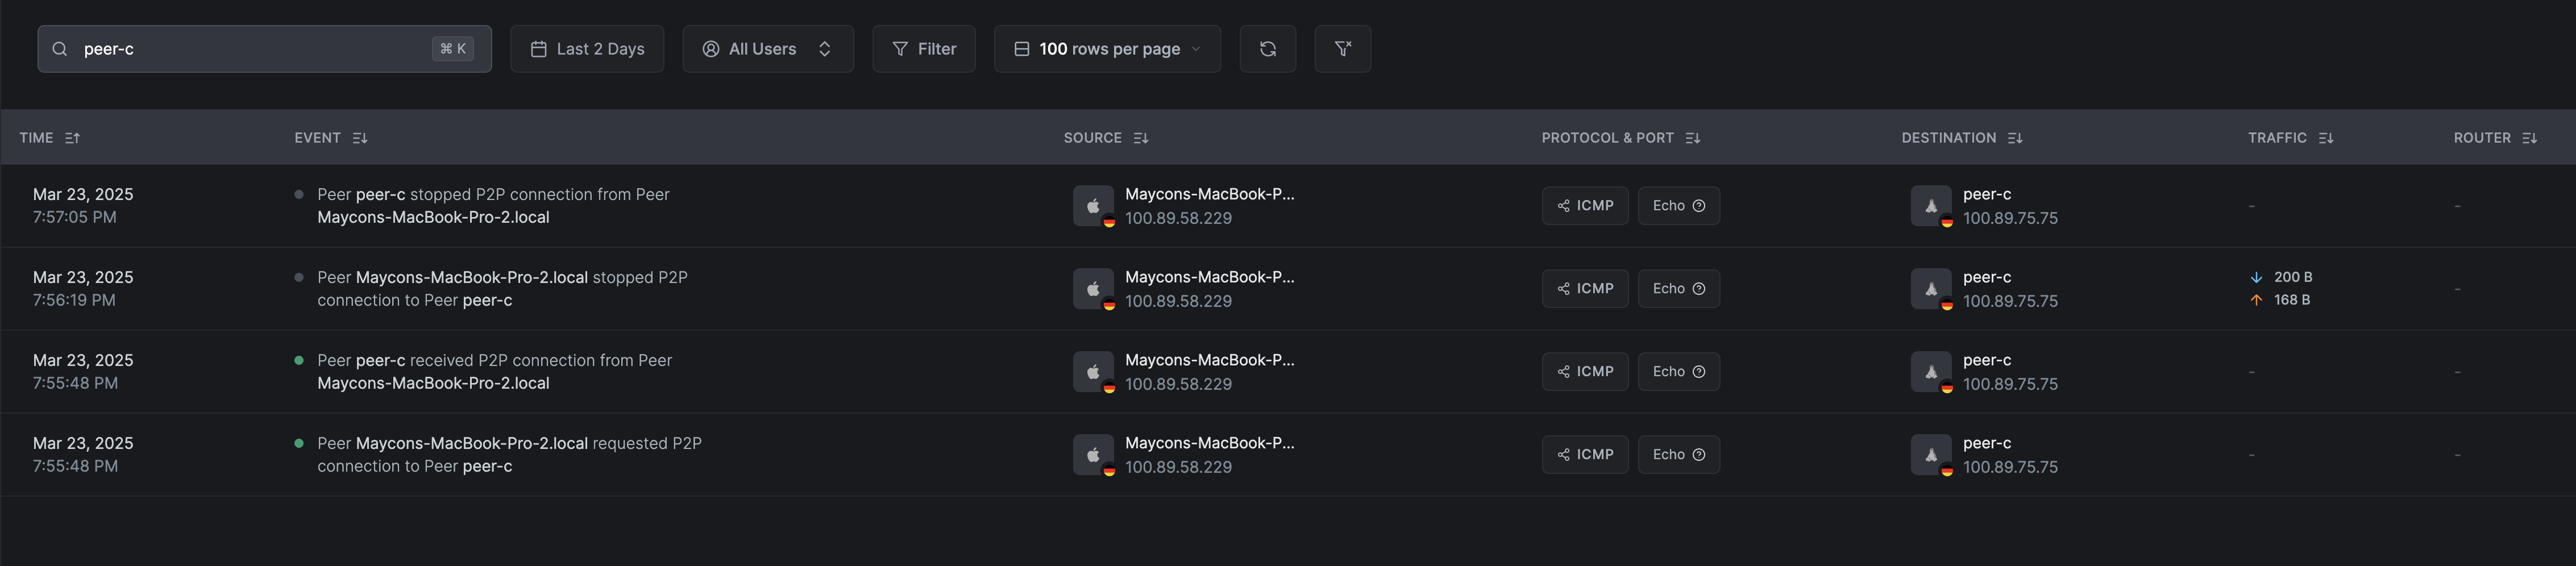
ICMP is grouped by ICMP type and does not use ports. Its end counter is updated after inactivity.
Routed events
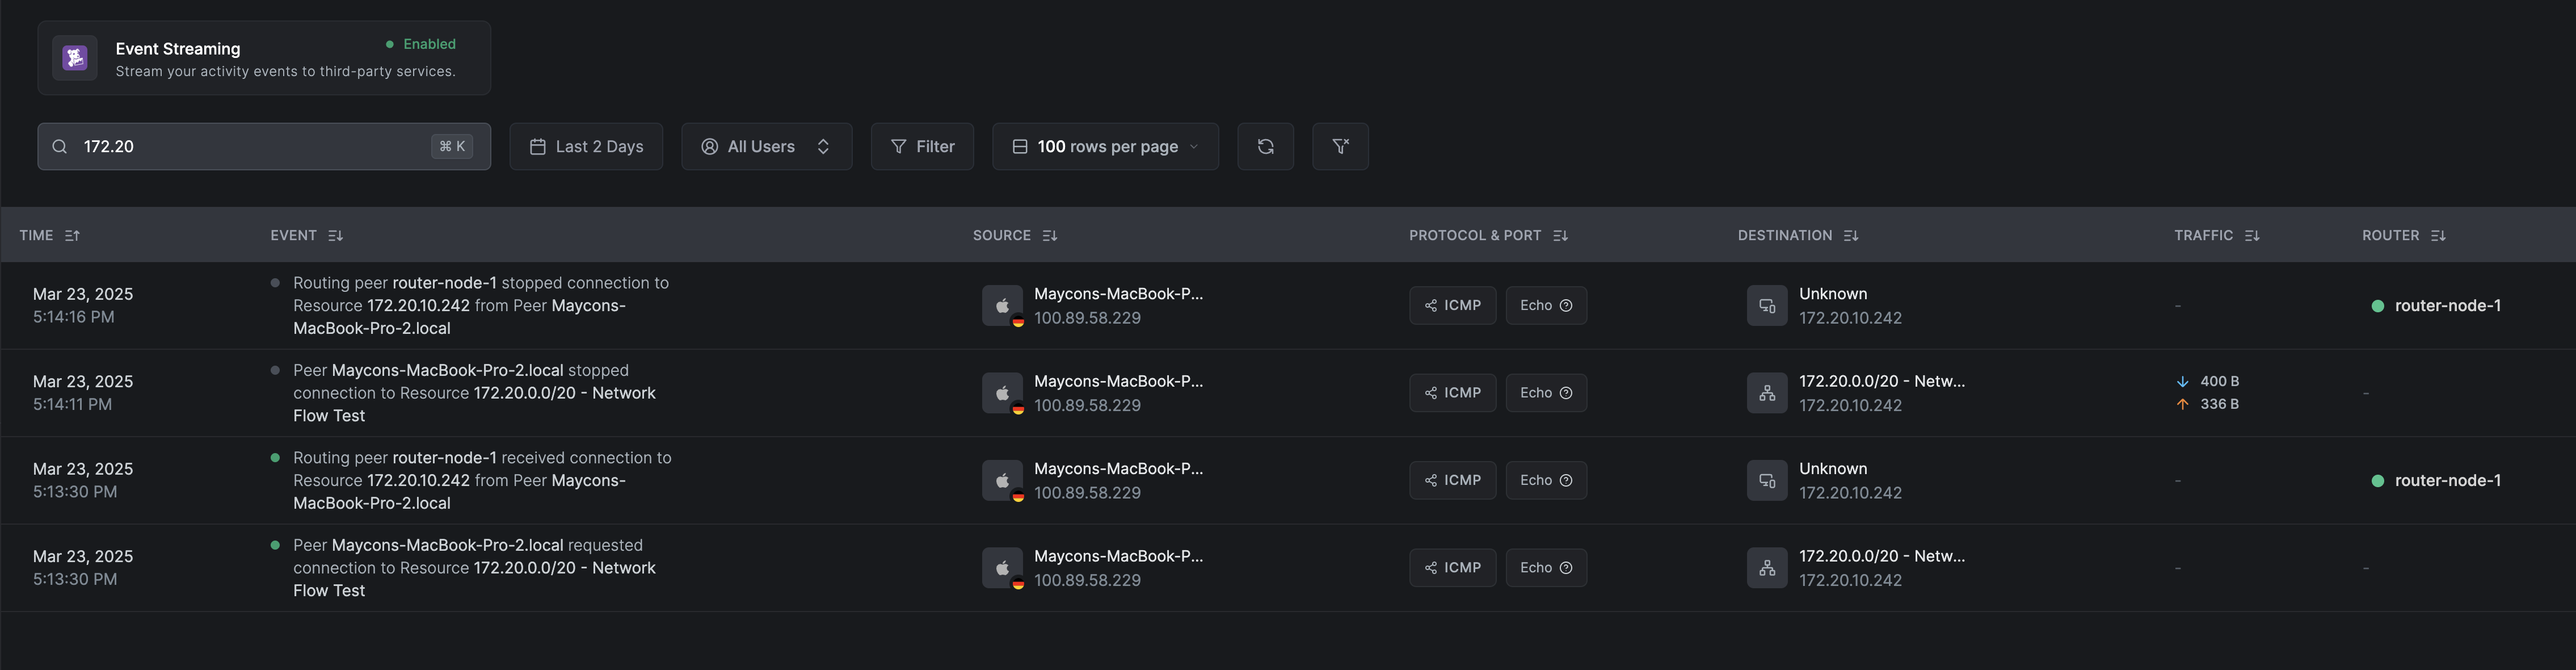
Routed events follow the same pattern as P2P events. The main difference is that the destination or source can be a resource or network route. Below, we have a few examples of a connection from a peer to a resource:
ICMP:
TCP:
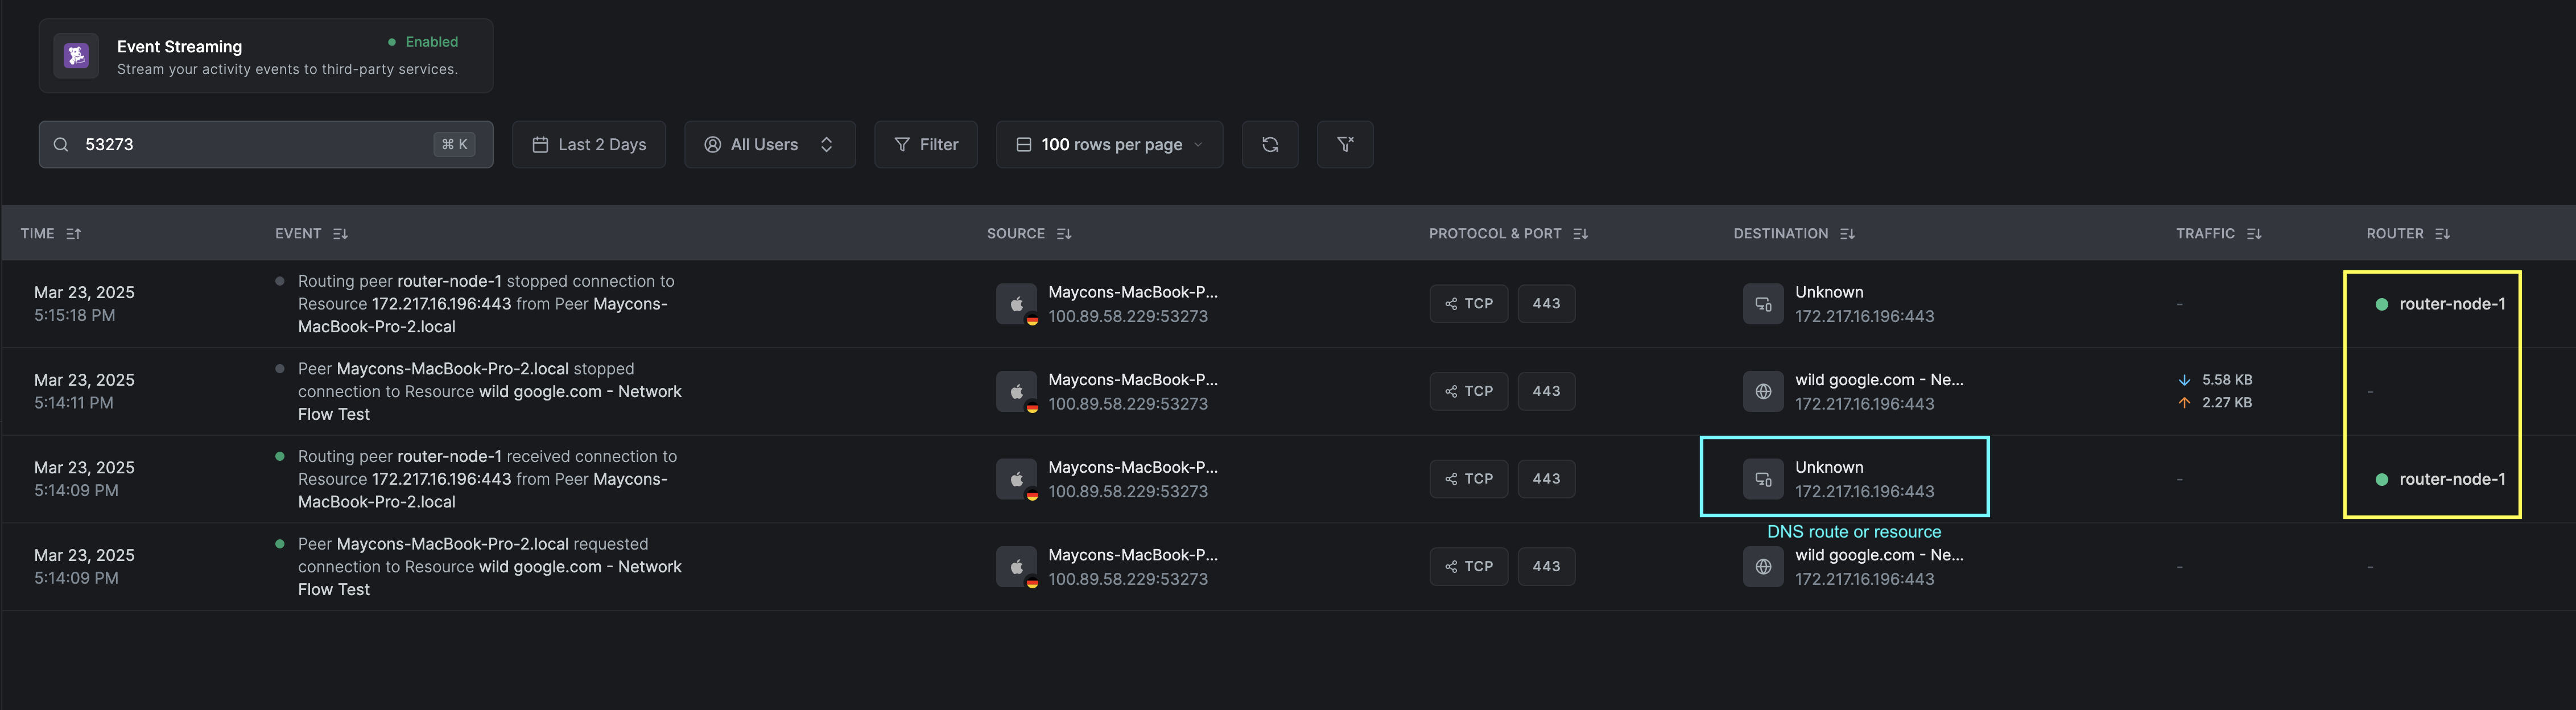
For routed aggregates, the source or destination can be a resource or network route. The record identifies the routing peer that reported it. The source or destination identifier can be unknown on the routing-peer side for DNS resources.
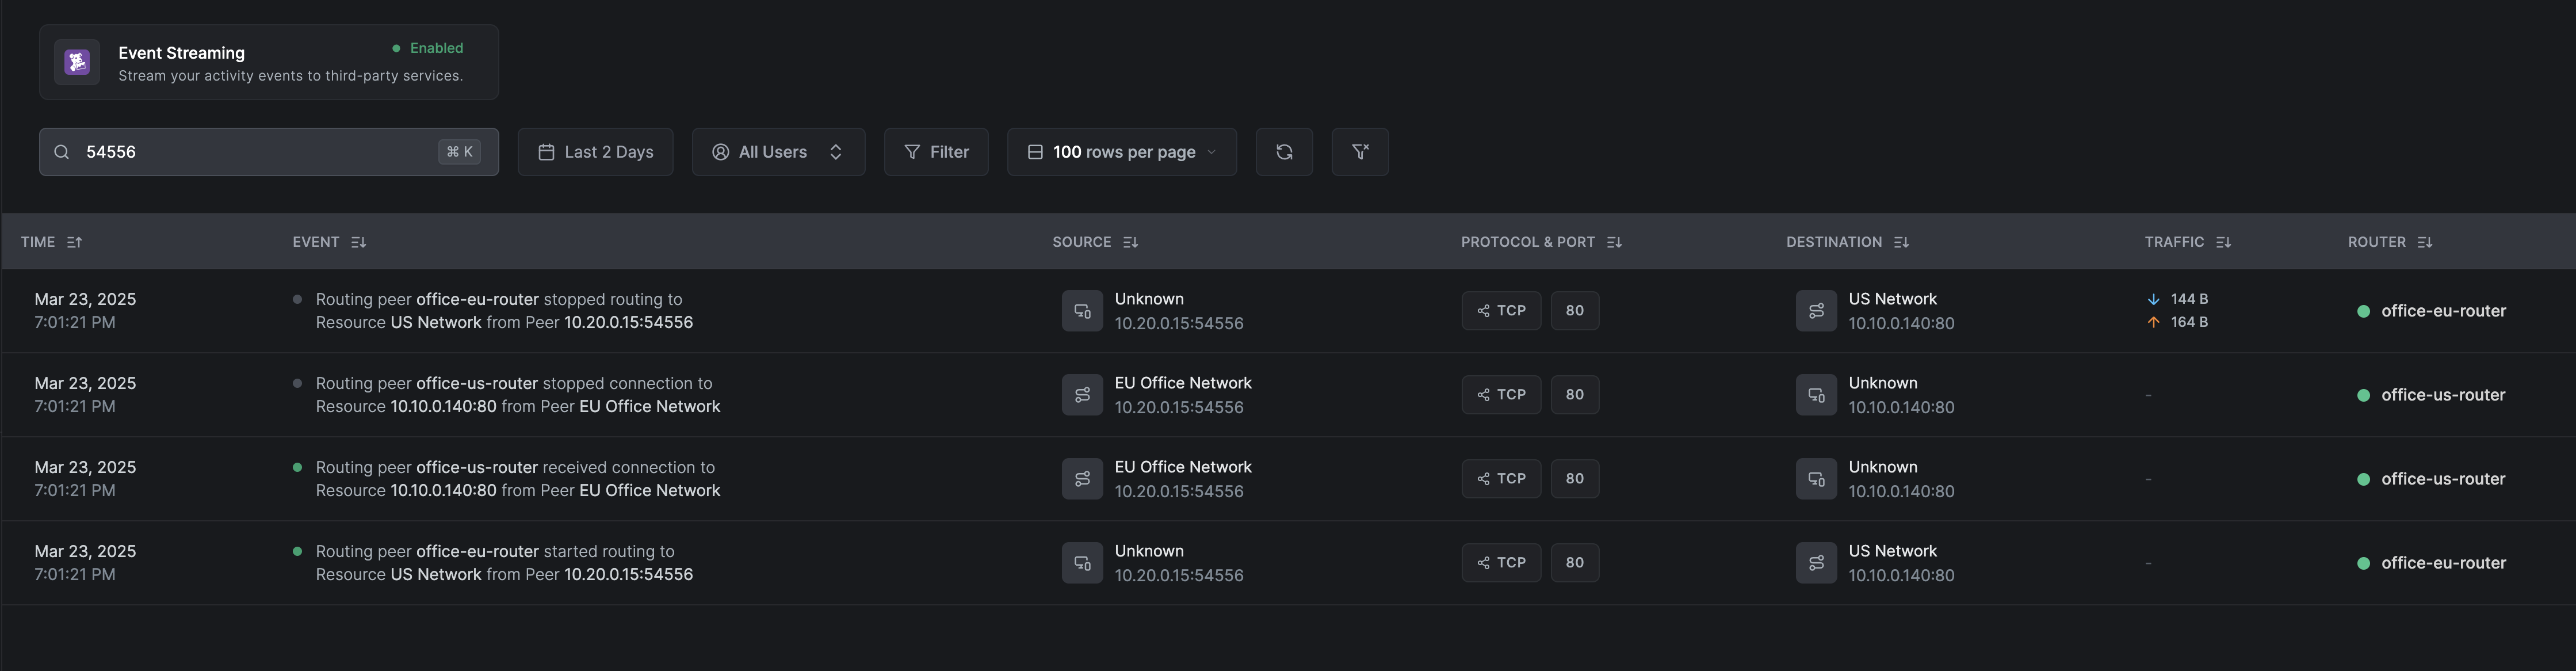
For site-2-site connections, the events will be similar to the above examples, but you will see a routing peer for each event:
Limitations
Policy IDs and blocked traffic events are not reported when the destination peer (or routing peer) is running in kernel mode.
On Linux, you can force a routing peer into userspace mode with three environment variables:
sudo netbird service reconfigure --service-env NB_WG_KERNEL_DISABLED=true,NB_FORCE_USERSPACE_FIREWALL=true,NB_FORCE_USERSPACE_ROUTER=true
Traffic that is not recorded
Some traffic never produces a traffic event, whatever the peer mode:
- DNS queries over UDP. The NetBird client does not record UDP traffic to port
53, or to ports5353and22054, which the NetBird DNS forwarder uses on routing peers. This also applies to other UDP traffic on these ports, such as mDNS. DNS over TCP is recorded as an ordinary flow. - Traffic through an exit node. Flows matched to an exit node route (
0.0.0.0/0) are not recorded, on the client or on the exit node. Traffic to a destination covered by a more specific route or Networks resource is still recorded. - Access withdrawn by a failed posture check. When a peer fails a posture check, the policy stops applying and the connection between the peers is removed. No traffic reaches either peer's firewall, so there is nothing to record as allowed or blocked.
Conclusion
Traffic events logging provides a powerful tool for monitoring and analyzing network traffic across your infrastructure. Enabling this feature can provide valuable insights into network activity, enhance security measures, and improve operational efficiency. The ability to correlate events, view detailed traffic data, and stream events to SIEM systems empowers you to make informed decisions and take proactive steps to protect your network environment.