Stream Activity Events to Wazuh
Wire NetBird's Event Streaming → Generic HTTP integration to a Wazuh manager so every audit event and traffic event lands in Wazuh as a searchable alert.
Prerequisites
- A running Wazuh stack (4.14+) with a public, TLS-terminated webhook endpoint that NetBird Cloud can POST to. If you don't have one, see the Wazuh receiver reference architecture for a starter deployment built around
wazuh/wazuh-docker+ Caddy. - The shared secret your receiver expects in the
X-API-KeyHTTP header. If you're deploying the receiver from scratch, you'll generate this as part of its.env. If a receiver is already running, use the value ofNB_WEBHOOK_SECRETfrom its.env. - The receiver writes each NetBird event as a single JSON line to a file the Wazuh manager tails via a
<localfile>block with<log_format>json</log_format>, and ships with a starter ruleset under custom rule IDs100100–100106(audit) and100200–100202(traffic). The verification steps below assume that wiring.
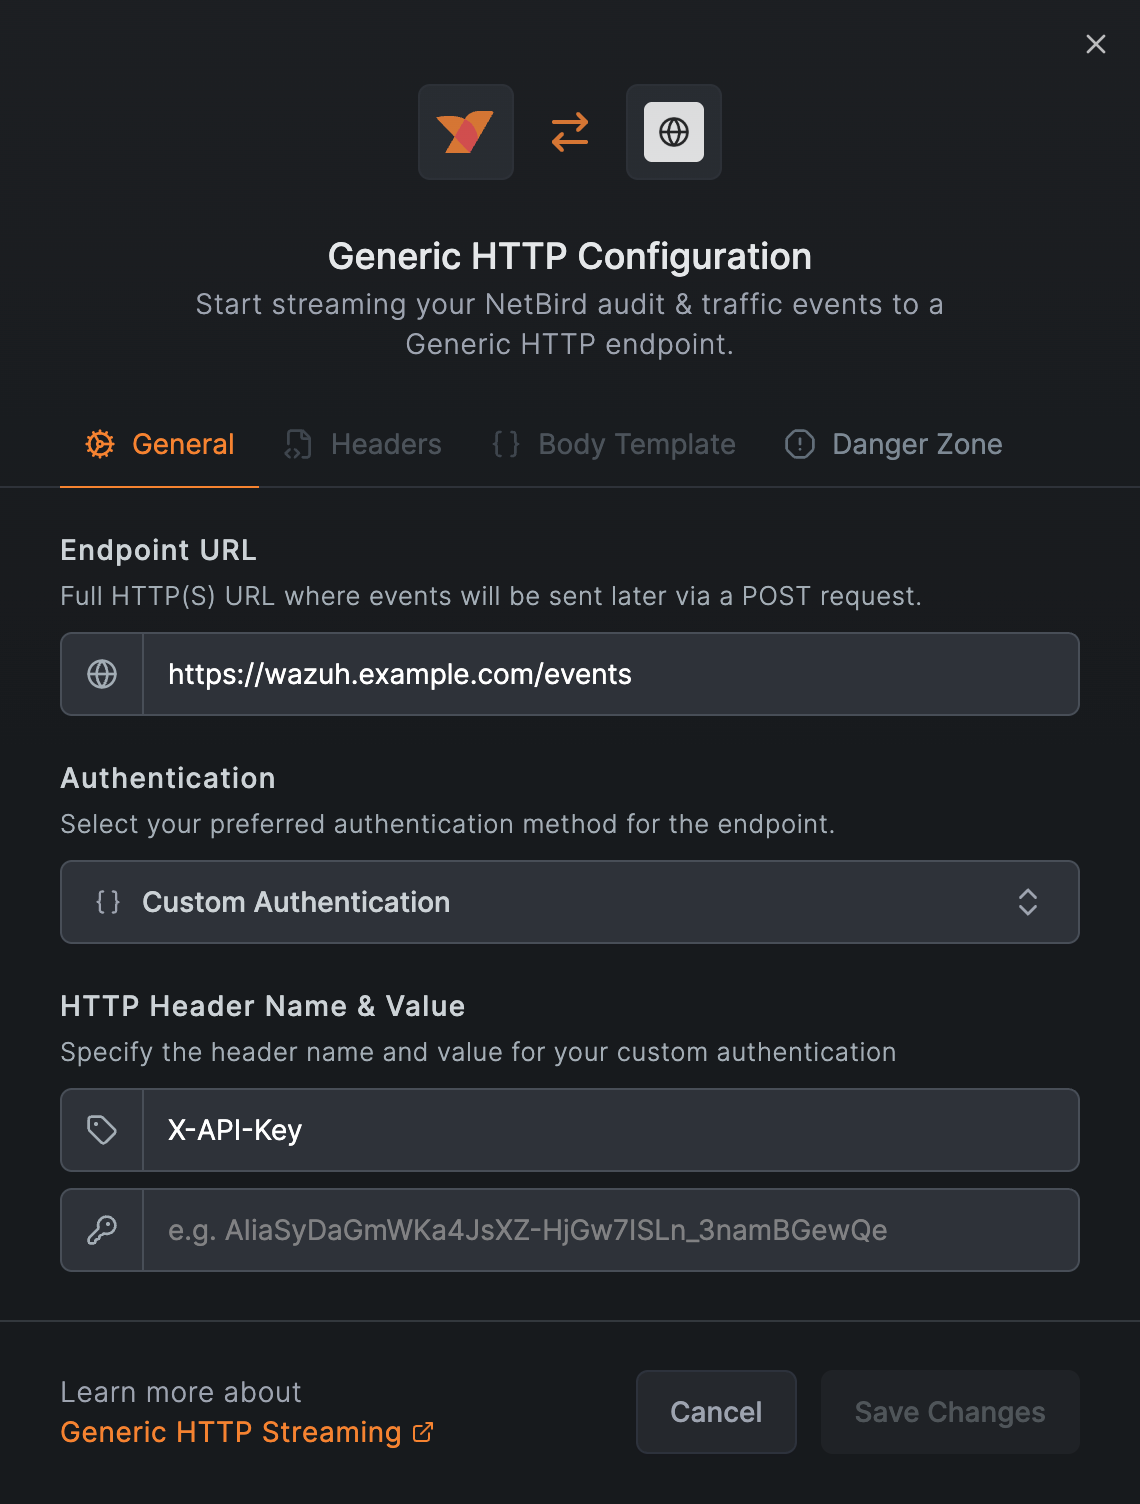
Step 1 — Configure NetBird's Generic HTTP integration
- Integrations → Event Streaming, find Generic HTTP, click Connect.
- Fill the General tab:
- Endpoint URL:
https://YOUR-HOSTNAME/events - Authentication: Custom Authentication
- Header name:
X-API-Key - Header value: the secret from the prerequisites
- Endpoint URL:
- Leave Headers and Body Template at their defaults.
- Save Changes.
Don't use a custom body template. In testing, NetBird's body-template engine HTML-escapes string values (so + becomes +, mangling ISO-8601 timestamps and URLs with special characters), and there's no JSON-encoding helper for meta. The default body is the right choice for Wazuh.
On save NetBird POSTs a synthetic test event to your endpoint and rejects the save with a 412 if the receiver doesn't return 2xx (observed in NetBird Cloud, May 2026). A successful save also generates an "integration created" audit event that streams back through the same integration; that's NetBird logging its own configuration change. Subsequent edits produce "integration updated" the same way.
Step 2 — Verify in the Wazuh dashboard
Open the Wazuh dashboard, log in, then ☰ → Explore → Discover.
Audit events
Set the index pattern to wazuh-alerts-* and run this KQL:
rule.groups : "netbird" and not data.nb.Message : TYPE_*
Set the time picker to Last 15 minutes and add these columns from the field selector: rule.id, rule.level, rule.description, data.nb.InitiatorID, data.nb.target_id.
You should see one row per audit event (peer add/remove, policy change, group create, etc.) with rule.description reading like NetBird group event: group created.
If data.nb.* doesn't appear in the field selector, the index pattern's field cache is stale. Go to ☰ → Stack Management → Index Patterns → wazuh-alerts-* and click the ↻ Refresh fields icon at the top right, then return to Discover; all data.nb.* fields will appear.
Traffic events
If you've also enabled Traffic Events Logging for one or more groups, switch the KQL to:
rule.groups : "traffic"
Useful columns: rule.id, rule.level, rule.description, data.nb.meta.source_name, data.nb.meta.destination_addr, data.nb.meta.tx_bytes.
TYPE_DROP events (rule 100202) escalate to level 7 to make policy denials stand out from normal flow telemetry.
Schema reference
NetBird emits two distinct event shapes through the same integration. Both arrive wrapped in a small envelope so they don't collide with Wazuh's index template:
{
    "_stream":     "netbird-events",
    "received_at": "<receiver-side ISO 8601 timestamp>",
    "nb":          { "the NetBird payload": "..." }
}
received_at is the receiver's local timestamp at the moment the POST was accepted. Compare it against nb.Timestamp (set by NetBird Cloud) to spot clock skew or buffering delays in the streaming path.
Audit events
{
    "ID":          22456950,
    "Timestamp":   "2026-05-08T12:57:57.00483949Z",
    "Message":     "integration created",
    "InitiatorID": "oauth2|azure-oauth2|<user-uuid>",
    "target_id":   "event_streaming:1172",
    "meta":        { "platform": "generic_http" },
    "reference":   "https://app.netbird.io/activity?id=22456950"
}
- Casing is mixed on the wire:
ID,Timestamp,Message,InitiatorIDare PascalCase;target_id,meta,referenceare snake_case. KQL queries against the indexer are case-sensitive, so match the on-the-wire form exactly:data.nb.Message,data.nb.target_id, etc. The same applies to Wazuh rule<field name="...">references. IDmay be a number or a string (test events use a string identifier; real audit events use a numeric ID). Wazuh normalises both to strings in the indexeddata.nb.ID, so KQL queries don't need to handle the mixed type.Messageis the most reliable field to pivot rules on; it's a stable English phrase like "peer added" or "policy created".referenceis the canonical URL into NetBird's activity log; useful as a click-through pivot from a Wazuh alert back to the source event.metais event-type-specific. Peer events carrymeta.name, setup-key events carrymeta.type, integration events carrymeta.platform. Treat unknown keys as opaque.
Traffic events
{
    "ID":          "<flow uuid>",
    "Timestamp":   "2026-05-08T10:33:41.723079Z",
    "Message":     "TYPE_START",
    "InitiatorID": "",
    "target_id":   "",
    "reference":   "",
    "meta": {
        "flow_id":          "<uuid>",
        "direction":        "EGRESS",
        "source_addr":      "100.121.42.206:0",
        "source_name":      "Jacks-MacBook-Air.local",
        "source_type":      "PEER",
        "destination_addr": "100.121.255.254:0",
        "destination_name": "",
        "destination_type": "PEER",
        "protocol":         6,
        "tx_bytes":         56,  "tx_packets": 1,
        "rx_bytes":         0,   "rx_packets": 0,
        "policy_name":      "",
        "reporter_id":      "<peer-id-of-reporter>",
        "user_id":          "oauth2|azure-oauth2|<user-uuid>"
    }
}
Traffic events keep the same envelope as audit events: ID and Timestamp are populated; InitiatorID, target_id, and reference are intentionally empty (the actor lives in meta.user_id, source/destination identity in meta.source_* / meta.destination_*).
destination_nameis usually empty;destination_addr(overlay IP) is always set.protocolis an IANA number (1=ICMP,6=TCP,17=UDP,58=ICMPv6).- A single flow can produce both a
TYPE_STARTand aTYPE_ENDevent sharingmeta.flow_id. Filter ondata.nb.Message : "TYPE_START"to count distinct flow starts and avoid double-counting lifecycle pairs. - Volume is an order of magnitude higher than audit events on a busy mesh; size your retention and rate limits accordingly.
Wazuh's JSON decoder strips empty-string and empty-object fields when it extracts events into data.nb.*. Fields shown as "" or {} in the schema examples above (such as destination_name, policy_name, an empty meta on some audit events) won't appear in indexed alerts, so KQL queries like data.nb.meta.destination_name : * return zero hits. The original wire payload is preserved in full_log if you ever need the raw form; for queryable fields, filter on a populated one instead.
Next steps
- Build out a starter deployment with a webhook receiver, Caddy in front, and the rules referenced here: Wazuh receiver reference architecture.
- Set up a freshness watchdog by pointing an external uptime monitor (UptimeRobot, Prometheus blackbox-exporter, etc.) at the receiver's
/healthzendpoint. NetBird's retry behaviour on 5xx is undocumented, so external monitoring is the best way to catch a downed receiver quickly.