Usage Overview
Updated
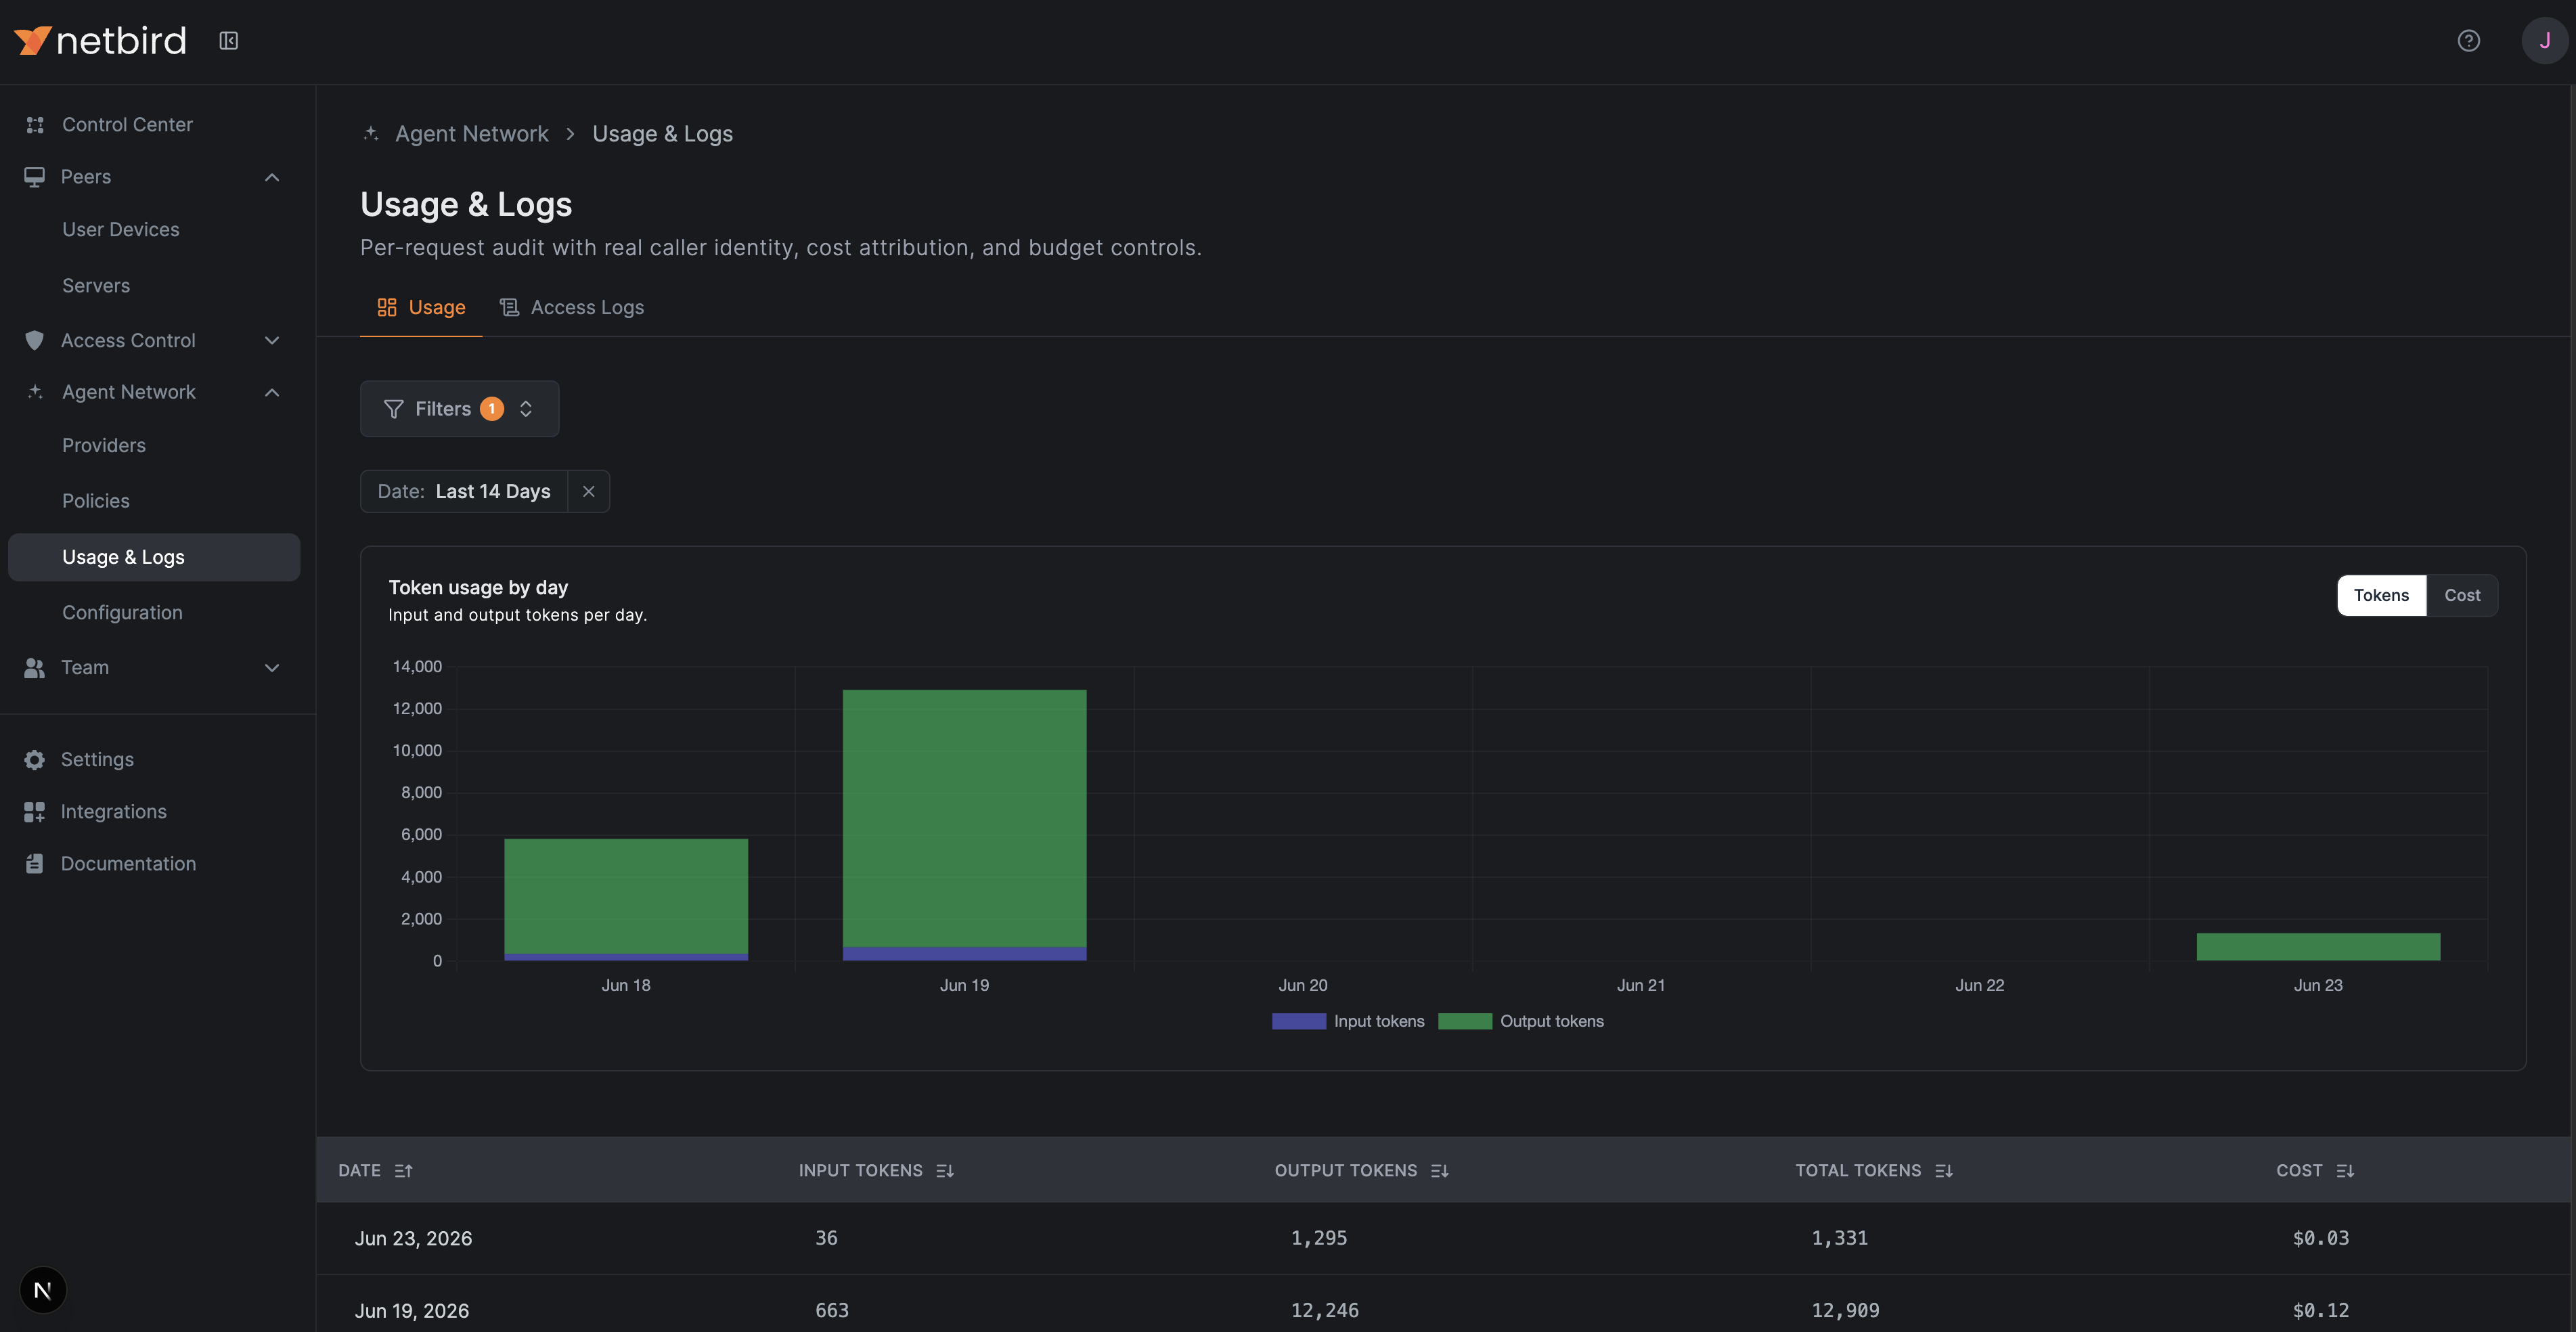
The Usage tab shows account consumption over time as a per-day chart with a Tokens / Cost switch, plus a breakdown table.
Filters
Filter the view by:
- Date — defaults to the last 14 days.
- User
- Group
- Provider
- Model
Filters apply to both the chart and the table.
Tokens vs. Cost
Switch between input/output token totals and estimated USD spend. Cost is derived from the per-model pricing configured on each provider.
Always Collected
Usage is recorded on every request independently of access-log collection, so this view stays complete even when logs are disabled.